Every time you use your favourite chat bot, you’re driving demand for natural gas.
That’s not a metaphor. That’s the supply chain.
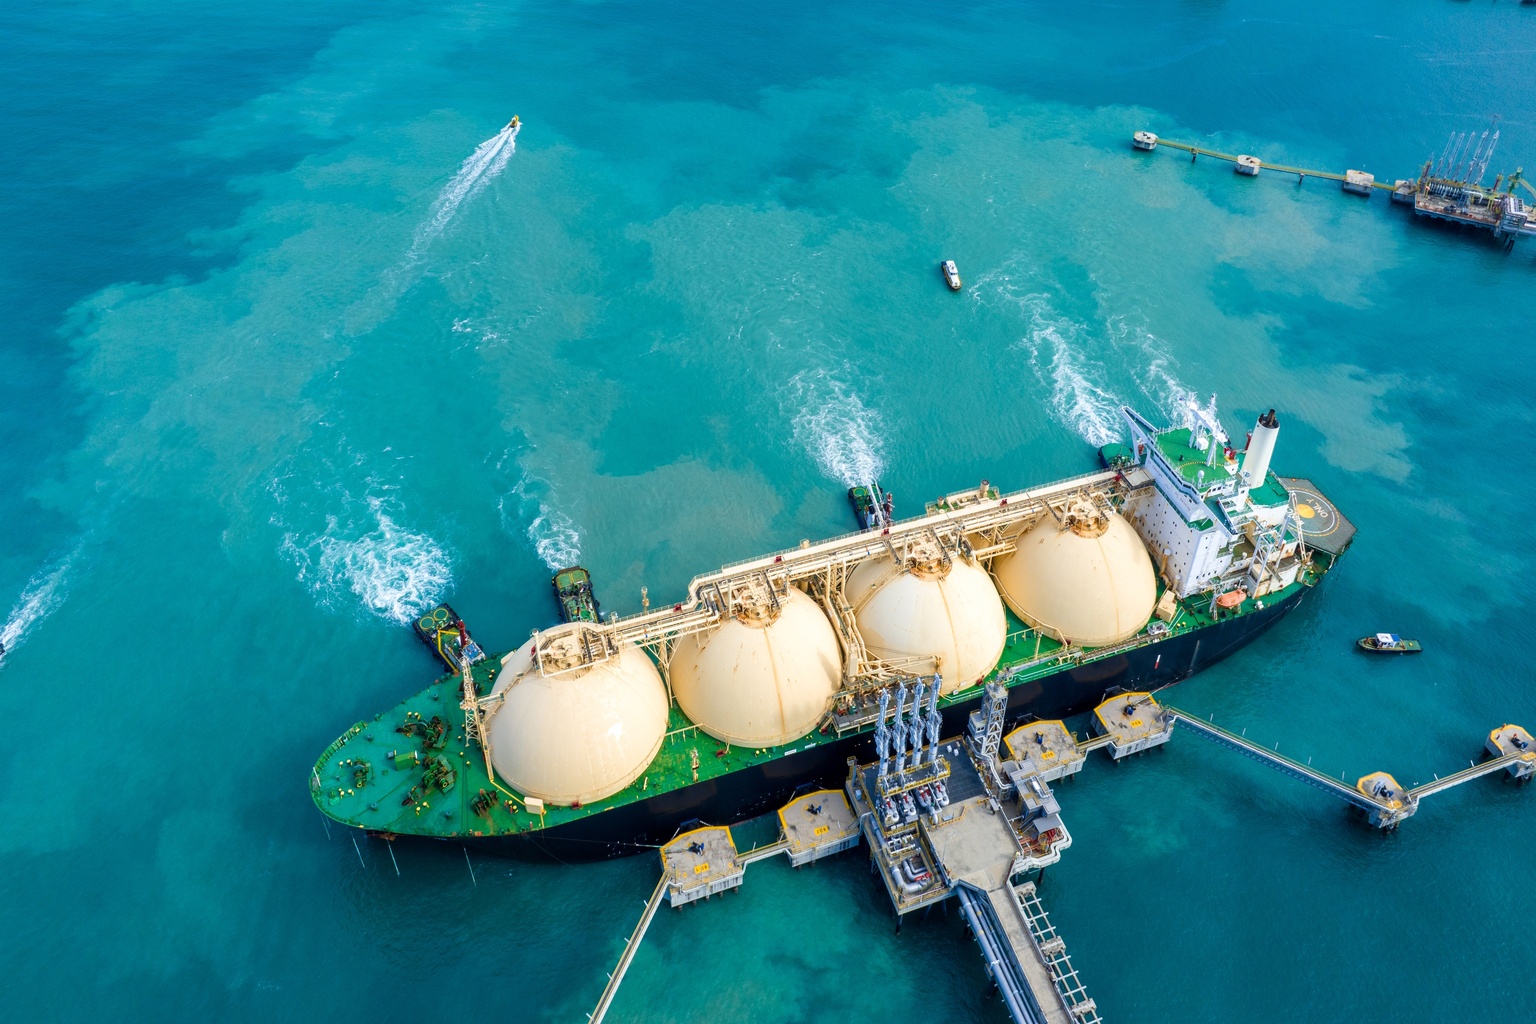
AI runs on data centers. Data centers run on electricity. And right now, the most reliable way to generate that electricity at scale — especially in Asia, where most of the world’s new data centers are being built is natural gas. Specifically, liquefied natural gas. LNG.
Most people think of LNG as an old-economy story. A pipeline thing. A geopolitics thing. Boring.
They’re wrong. And that gap between perception and reality is exactly where the interesting trades live.
Here’s what’s actually happening.
The world is in the early innings of the largest LNG supply expansion in history. Global LNG capacity is expected to jump by more than 150 million tonnes per year by 2030. The US and Qatar are leading the buildout, but Canada just shipped its first cargo to Asia through LNG Canada’s Kitimat terminal — and the race is on.
At the same time, demand is being pulled from multiple directions at once:
Europe structurally decoupled from Russian pipeline gas after 2022. That’s not reversing. The EU is legally committed to ending Russian LNG imports entirely, which means Atlantic cargoes stay in high demand regardless of what happens elsewhere in the market.
Asia is the real engine. Japan, South Korea, India — these are economies that run on imported energy and are actively diversifying away from Middle Eastern supply routes. The Strait of Hormuz disruption earlier this year made that urgency impossible to ignore. When Qatar had to suspend production, Asian buyers scrambled. Canadian LNG — which takes half the shipping time to Asia compared to US Gulf Coast exports — suddenly looked very strategic.
And then there’s the demand driver nobody’s pricing in correctly: AI infrastructure.
Data center electricity demand in the US alone is expected to jump 7.7 gigawatts in 2026. In Southeast Asia, new hubs in Singapore, Malaysia, and Thailand are already straining local power grids. These grids are being backstopped by LNG-powered generation. So every hyperscaler that builds a new facility is quietly adding to gas demand on the other side of the world.
This is a feedback loop. More AI → more data centers → more power demand → more LNG. And it compounds.
So why isn’t everyone talking about this?
Because the narrative is confusing.
The Japan-Korea Marker (JKM), the key Asian LNG spot price, is sitting around $15–16/MMBtu as of mid-April 2026 — down from nearly $19 in early April when Middle East tensions peaked, and sharply below the $12 baseline Bernstein was forecasting for a normal 2026. The European benchmark TTF has also softened to around $15/MMBtu after spiking above $17 during the Iran conflict. Meanwhile, Henry Hub — the US benchmark — sits at roughly $3.10/MMBtu, giving you a JKM-to-Henry Hub spread of around $12–13/MMBtu right now.
That spread is the heartbeat of the entire LNG export thesis. When it’s wide, US and Canadian producers have a strong economic incentive to liquefy and ship. When it narrows — as it’s expected to during the 2026–2028 supply glut — margins compress and the trade gets harder to justify on the spot market. Bernstein forecasts JKM averaging around $9/MMBtu through 2026–2028 as new supply floods in. That’s the bear case.
But here’s what the bears are missing: most of this new capacity — including LNG Canada — is tied to long-term contracts, not exposed to spot. The spot volatility is real, but it doesn’t break the economics of projects already committed and flowing. The glut affects new projects seeking final investment decisions far more than it affects anything already in the ground.
For the thesis to fully play out on the spot side, you need JKM to hold above roughly $8–10/MMBtu — the approximate all-in cost of Canadian liquefaction, pipeline tariffs, and shipping to Northeast Asia. Right now, even in the compressed market, we’re well above that level. The margin exists. It’s just thinner than the post-Ukraine spike made it look.
The price that actually matters for Canada: AECO.
Most investors focus on JKM or Henry Hub. But if you’re tracking the Canadian upstream opportunity, the number to watch is AECO — Alberta’s domestic gas benchmark.
AECO has historically traded at a steep discount to Henry Hub because Canadian producers had nowhere to send their gas except south into the US, where they were price-takers. In 2024, AECO was averaging below C$1.70/GJ — effectively giving gas away. The Alberta Energy Regulator’s base case now forecasts AECO rising to C$3.82/GJ in 2026, underpinned by LNG Canada Phase 1 running at full capacity and a second train ramping through the year.
Every $1/GJ increase in AECO translates to roughly $7 billion per year in additional revenue across the Canadian upstream sector. That’s the math that makes this a national economic story, not just an energy sector one.
The risk is real though: AECO basis remains structurally wide versus Henry Hub, and some analysts don’t see it narrowing to the minus $0.75–1.00/MMBtu range that Tourmaline — Canada’s largest gas producer — sees as a reasonable equilibrium until early 2029, when LNG Canada Phase 2 and other projects add more export pull. If LNG volumes disappoint or Chinese demand stays muted, basis blows out again and the AECO recovery stalls.
This isn’t a 2026 trade. Here’s the timeline.
If you’re thinking about positioning around this theme, the horizon matters enormously.
2026–2027 — Compressed but not broken. The supply glut is real. New LNG capacity from the US, Qatar, and Canada is hitting the market faster than demand is absorbing it. Spot prices are soft. But the Hormuz disruption has added a geopolitical risk premium that’s keeping prices elevated relative to fundamentals. Structurally loose conditions are unlikely to return before 2028 — the supply shock from Qatar’s production damage could take 3–5 years to fully repair. This is the phase where the trade requires patience and a long enough time horizon.
2028–2030 — The tightening. New LNG capacity stops growing as fast, demand from price-sensitive markets accelerates (India, Vietnam, Bangladesh all have import terminals but have been priced out of the spot market for years — cheaper LNG opens that demand), and the AI power demand story becomes impossible to ignore. This is the phase where the macro thesis starts showing up in prices.
2030 and beyond — The payoff. Canada targets 45 MTPA of export capacity by the early 2030s. If that happens — LNG Canada Phase 2, Cedar LNG, Woodfibre LNG, Ksi Lisims — Alberta’s gas goes from stranded asset to global commodity. Shell forecasts global LNG demand growing 60% by 2040. Someone has to supply that. Canada is positioned to be a major part of the answer.
Where the value is right now.
This isn’t a trade where you buy one thing and wait. It’s a theme with multiple entry points depending on your horizon and risk tolerance.
Canadian upstream producers are the highest-leverage play on the AECO recovery. Tourmaline Oil (TOU.TO) — Canada’s largest natural gas producer — is trading around $59.79 as of mid-April, roughly 28% below its recent highs, despite analysts projecting the stock could double by 2028 as free cash flow compounds. It generates strong cash flow even at current soft prices: $720 million in a single quarter last year through historically weak AECO conditions. ARC Resources (ARX.TO) is another name analysts track closely — also Montney-weighted and LNG Canada-linked. Both are essentially long AECO recovery and long Canadian export infrastructure buildout. The risk is straightforward: if AECO doesn’t recover, the stock doesn’t work. Simple commodity leverage.
LNG infrastructure and midstream is a lower-volatility angle — TC Energy (TRP.TO), which operates the Coastal GasLink pipeline feeding LNG Canada, earns regulated returns largely independent of commodity prices. You’re not betting on LNG prices; you’re betting on volumes flowing through pipes. More boring. Also more resilient.
LNG shipping is currently the most beaten-up part of the value chain and potentially the most interesting contrarian setup. Charter rates hit record lows in early 2025 as fleet growth of 17% ran ahead of volume growth of 7%. The Clarksons data makes this explicit: the orderbook is the largest in shipping history at 44% of fleet. But by 2030, LNG trade volumes are forecast to grow 60% — from 412 million tonnes to 650 million tonnes. Shipping capacity ordered today delivers into that demand wave. If you have the patience for a 3–4 year drawdown, there may be a case for LNG shipping names near cycle lows. High risk, high optionality.
The bottom line.
LNG sits at the intersection of three of the most powerful forces in the global economy right now: AI infrastructure build-out, geopolitical realignment, and the energy transition.
The benchmarks tell you the short-term story: JKM at $15, AECO recovering toward C$3.82, Henry Hub at $3.10. The long-term story is 150 million tonnes of new capacity, 60% demand growth by 2040, and Canada finally getting paid what its gas is worth.
It’s not a fossil fuel story. It’s not a clean energy story. It’s a transition story — and transition stories tend to run longer and generate more value than either side of the debate expects.
The trade of the decade rarely looks obvious at the start. The prices, the timelines, and the entry points are right in front of you. What you do with them is up to you.
Primary Sources
JKM / TTF / Henry Hub — Current Price Levels
- Global LNG Hub — Natural Gas Prices Weekly Update: JKM, TTF and Henry Hub (13 April 2026) JKM ~$16–17/MMBtu, TTF $15.0/MMBtu, Henry Hub $3.1/MMBtu as of April 10, 2026. https://globallnghub.com/natural-gas-prices-weekly-update-jkm-ttf-and-henry-hub-13-april-2026.html
- Trading Economics — LNG Japan Korea Price JKM fell to $15/MMBtu on April 17, 2026, still 24% higher year-over-year. https://tradingeconomics.com/commodity/liquefied-natural-gas-japan-korea
- LNG Price Index — Daily Benchmarks April 3, 2026 JKM $18.75, Henry Hub $2.81, JKM-HH spread $15.94/MMBtu.https://lngpriceindex.com/
JKM Price Forecast — Bear Case $9/MMBtu
- Energy Tracker Asia — LNG Prices in 2026: From Seller’s Market to Buyer’s Advantage Bernstein predicts spot JKM prices will average roughly $9/MMBtu over the 2026–2028 period. https://energytracker.asia/lng-prices-in-2026/
AECO Price — Current & Forecast
- Alberta Energy Regulator — AECO-C Price Forecast Base case: AECO rising to C$3.82/GJ in 2026, underpinned by LNG Canada Phase 1 running at full capacity. https://www.aer.ca/data-and-performance-reports/statistical-reports/alberta-energy-outlook-st98/prices-and-capital-expenditure/natural-gas-prices/aeco-c-price
- CAPP — Natural Gas Market Fundamentals, October 2025 AECO expected to average C$2.93/GJ in 2026 (futures-based estimate as of Oct 2025). https://www.capp.ca/wp-content/uploads/2025/11/Natural-Gas-Market-Fundamentals-October-17-2025.pdf
- Natural Gas Intelligence — Will Canada’s LNG Exports Matter for AECO Prices? Tourmaline VP Jamie Heard: AECO basis unlikely to tighten to –$0.75–1.00/MMBtu until 2029. NOVA/AECO forward basis for summer 2025 stood at –$2.590/MMBtu. https://naturalgasintel.com/news/will-canadas-lng-exports-matter-for-aeco-natural-gas-prices/
Henry Hub Forecast
- IER / EIA — LNG Canada Sent Its First LNG Shipment to Asia EIA projects Henry Hub to average $4.58/MMBtu in 2026, up from $2.28 in 2024. https://www.instituteforenergyresearch.org/fossil-fuels/gas-and-oil/lng-canada-sent-its-first-lng-shipment-to-asia/
$7 Billion Revenue Gain Per $1/GJ AECO Increase
- Resource Works — New Pipelines Already Proving Their Worth ARC Energy Research Institute’s Jackie Forrest: even a $1/GJ increase in Canadian gas prices from tidewater access yields producers an additional $7 billion per year.https://resourceworks.com/canada-pipelines-lng-growth/
LNG Supply Supercycle — 150 MTPA by 2030
- ADI Analytics — 2026 ADI Global Natural Gas & LNG Outlook Global LNG capacity will jump by more than 150 million tonnes per year by 2030, led by Qatar and the US. https://adi-analytics.com/2026/01/13/2026-adi-global-natural-gas-lng-outlook/
- IEA — Growth in Global Demand for Natural Gas Set to Accelerate in 2026 Global LNG supply growth accelerating to more than 7% in 2026 — fastest pace since 2019. North America accounts for the vast majority of the 40 bcm increase.https://www.iea.org/news/growth-in-global-demand-for-natural-gas-is-set-to-accelerate-in-2026-as-lng-wave-spreads-through-markets
LNG Trade 412 MT → 650 MT by 2030; Shipping Fleet Growth 17% vs Volume 7%
- Clarksons Research — LNG Shipping: Short-Term Headwinds, Long-Term Growth Fleet growth of 17% across 2024–25 set against volume growth of 7%. LNG trade forecast: 412 MT in 2024 → 650 MT by 2030 (60% growth). Orderbook at 44% of fleet — largest in shipping. Spot day rates hit record lows in early 2025. https://www.clarksons.com/home/news-and-insights/2025/lng-shipping-short-term-headwinds-long-term-growth/
AI & Data Center Power Demand
- BloombergNEF — Commodities in 2026: 10 Numbers to Watch The rapid expansion of the US data center fleet will lead to a 7.7GW jump in average power demand from the sector in 2026.https://about.bnef.com/insights/commodities/commodities-in-2026-10-numbers-to-watch-from-power-to-oil/
- PwC — Navigating the Future of LNG Rising electricity demand from AI data centers could represent up to 12% of US power by 2030, up from 3–4% today. https://www.pwc.com/us/en/industries/energy-utilities-resources/library/future-of-lng.html
- Gastech 2025 — The New Nexus of Power: US LNG, Global Interconnections, and the AI Data Center Boom Southeast Asia’s data center hubs in Singapore, Malaysia, and Thailand straining local power grids and driving demand for LNG-powered generation. https://www.gastechevent.com/press-collection/press-release/2026/february/the-new-nexus-of-power-us-lng-global-interconnections-and-the-ai-data-center-boom/
Europe Decoupling From Russian Gas
- ADI Analytics — 2026 ADI Global Natural Gas & LNG Outlook Europe’s plan to stop buying Russian LNG by end of 2026 will keep Atlantic cargo demand high. European LNG demand expected to grow ~5% in 2026. https://adi-analytics.com/2026/01/13/2026-adi-global-natural-gas-lng-outlook/
Strait of Hormuz / Qatar Production Disruption
- EIA — Short-Term Energy Outlook, April 2026 Gulf producers collectively shut in 7.5–9.1 million barrels/day. Brent averaged $103/barrel in March, expected to peak ~$115/barrel in Q2. https://www.eia.gov/outlooks/steo/
- Globe and Mail — Canada’s Second Chance in the Global LNG Race Qatar’s suspension of LNG production and the Iran war amplifying Canada’s case as a reliable alternative supplier. Qatar facility damage could take 3–5 years to repair.https://www.theglobeandmail.com/business/article-canadas-second-chance-in-the-global-lng-race/
Canada LNG Capacity — 19 MTPA by 2030, 45 MTPA by Early 2030s
- Norton Rose Fulbright — Canadian LNG Industry: 2026 Outlook Canada expected to reach 19 MTPA of export capacity by 2030; projects at FID could increase this to 45 MTPA by early 2030s. https://www.nortonrosefulbright.com/en-ca/knowledge/publications/10bef30f/canadian-lng-industry-2026-outlook
- Alberta.ca — Natural Gas Vision and Strategy Shipping from Canada’s West Coast to Asia: 11–13 days vs 20 days from the US Gulf Coast. https://www.alberta.ca/natural-gas-vision-and-strategy
Tourmaline (TOU.TO) — Stock Price & Fundamentals
- Motley Fool Canada — Top Canadian Natural Gas Stocks of 2026 Tourmaline trading ~28% below highs; analysts project the stock could double by 2028. Generated $720M in cash flow and $190M in earnings in a single quarter through historically weak AECO prices. https://www.fool.ca/investing/top-canadian-natural-gas-stocks/
- Stockchase — Tourmaline Oil Corp (TOU-T) TOU-T closed at $59.79 on April 17, 2026. https://stockchase.com/TOU-T
- Seeking Alpha — Tourmaline Oil: Deeply Undervalued Tourmaline rated Strong Buy; strategic LNG positioning, low breakeven prices, strong free cash flow growth through 2029. https://seekingalpha.com/article/4830639-tourmaline-oil-stock-strong-growth-expansion-plans-deeply-undervalued
Shell 60% LNG Demand Growth by 2040
- EnergyNow / BloombergNEF — Global LNG Market Faces Looming Supply Glut Shell, the world’s largest LNG trader, predicts global demand will surge 60% by 2040. https://energynow.com/2025/09/global-lng-market-faces-looming-supply-glut-after-years-of-scarcity/
Image via Clarksons Research (clarksons.com), July 2025.